Latency Topology Visualizer: Crypto Exchange Network
A Next.js application visualizing real-time and historical latency between major cryptocurrency exchanges and cloud regions globally, using a 3D interactive globe.
Rishabh Dubey
July 19, 2025 – July 27, 2025
Latency Topology Visualizer
This project creates an interactive visualization tool to understand latency performance in the cryptocurrency exchange network. It leverages a 3D globe interface to provide intuitive insight into real-time and historical latency data.
Overview
The application displays latency data between major cryptocurrency exchanges and geographically dispersed cloud regions. Users can filter the data by exchange, cloud region, and latency range. Animated lines connecting exchanges and regions illustrate latency levels. Both real-time and historical data are displayed, with real-time data retrieved via a public API and longer-term historical data initially provided by mock data until backend integration is implemented.
Key Features
- Interactive 3D globe visualization
- Real-time and historical latency data
- Animated connection lines with latency metrics
- Advanced filtering options
- Responsive UI for mobile and desktop
Technical Implementation
The application uses Next.js for the frontend, leveraging its features for server-side rendering and static site generation. Three.js is used for the 3D globe rendering. Data fetching is handled using asynchronous requests to a public latency API (Globalping, with a robust fallback mechanism). TypeScript provides static typing for enhanced code maintainability. ESLint and Prettier ensure consistent code style and quality. Docker is used for easy deployment and consistent development/production environments.
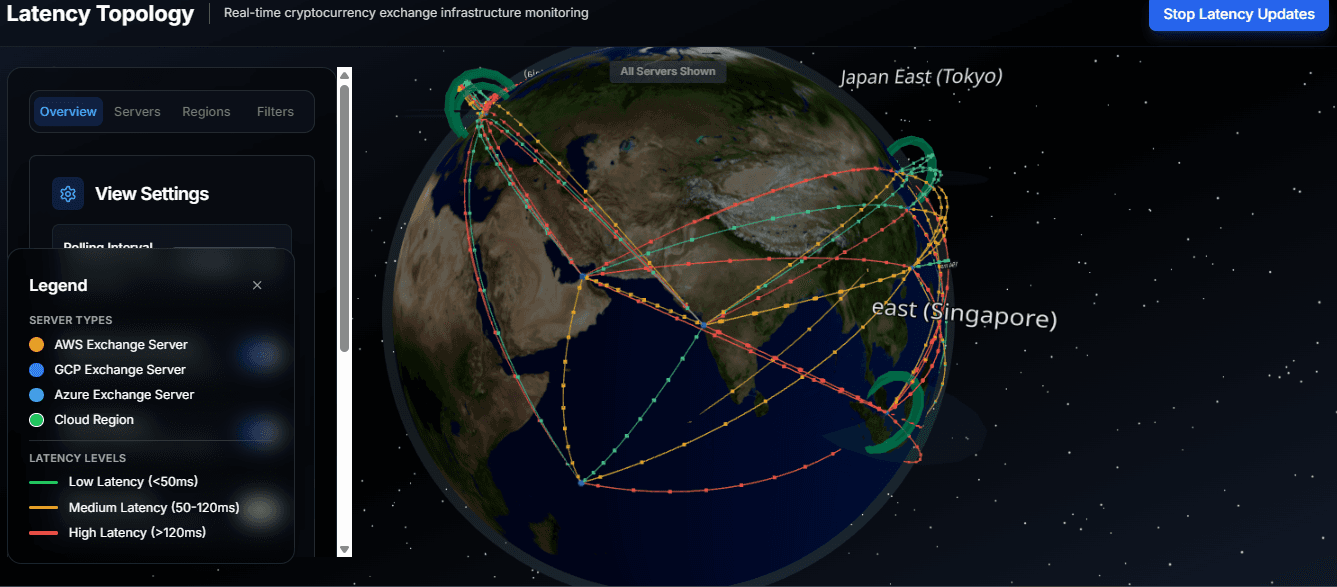
Challenges & Solutions
A key challenge is handling potential rate limits imposed by the public API. This was addressed by implementing exponential backoff and caching mechanisms. Another challenge is visualizing a large amount of data effectively on the globe. Region clustering and dynamic data loading techniques were employed to mitigate this. Initial reliance on mock data for historical data is a limitation to be addressed by future backend integration.
Understanding latency in the cryptocurrency exchange ecosystem is crucial for high-frequency trading and efficient platform operation. This visualizer provides actionable insights into network performance.
See more
More projects
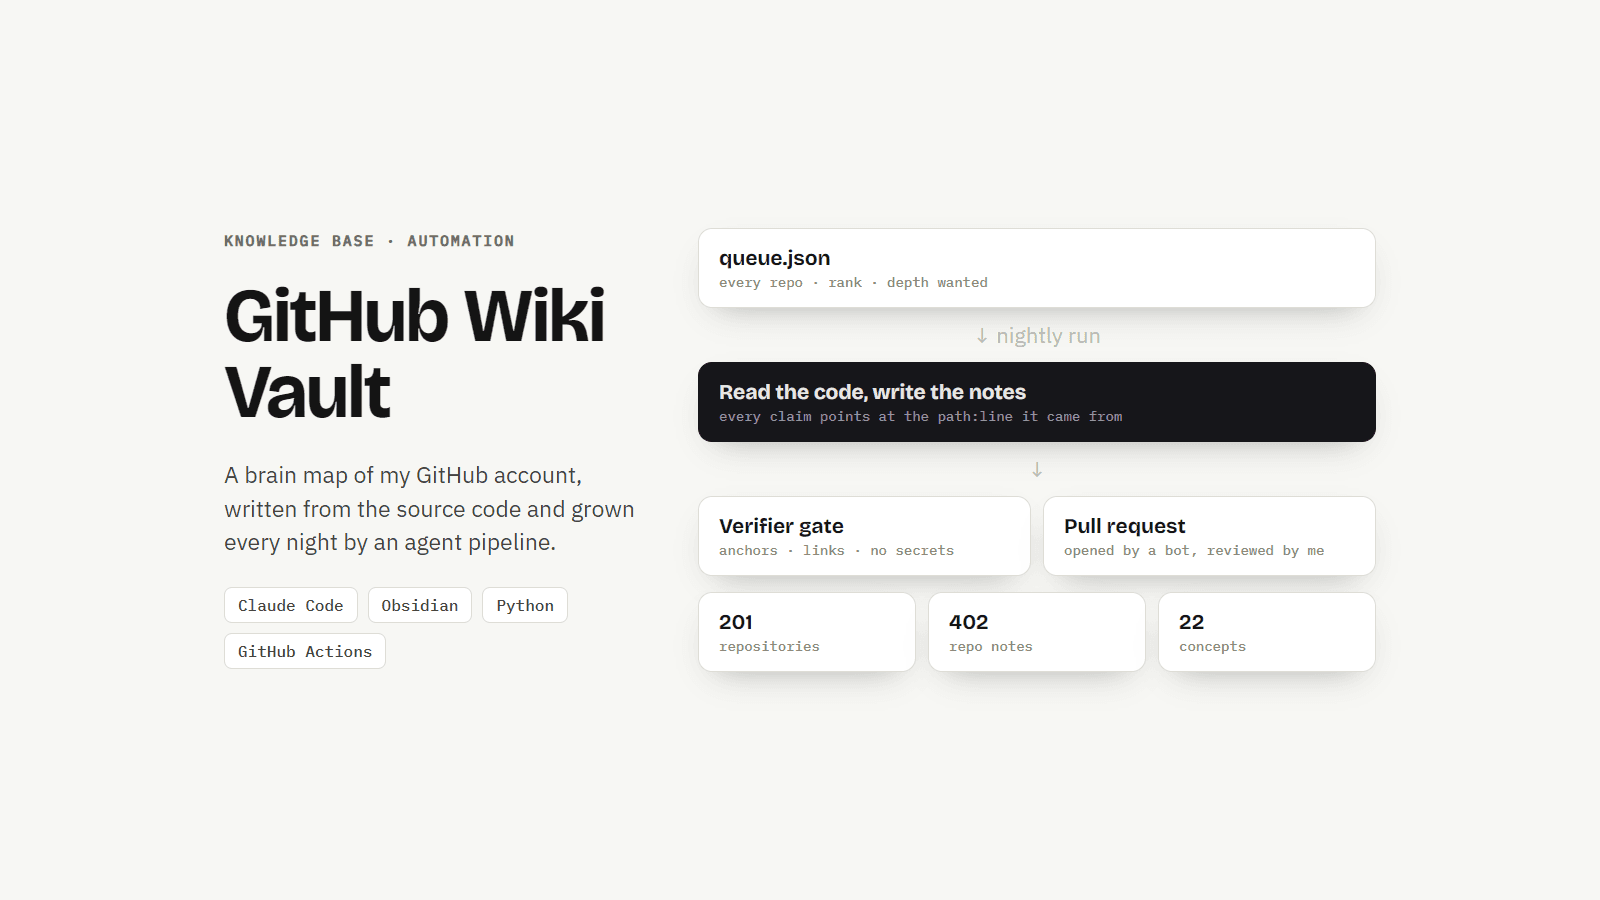
GitHub Wiki Vault: A Brain Map of My Code
An Obsidian vault that maps every repository on my GitHub account from its source code, grown every night by an AI agent pipeline that I designed and review. The code is private on purpose.
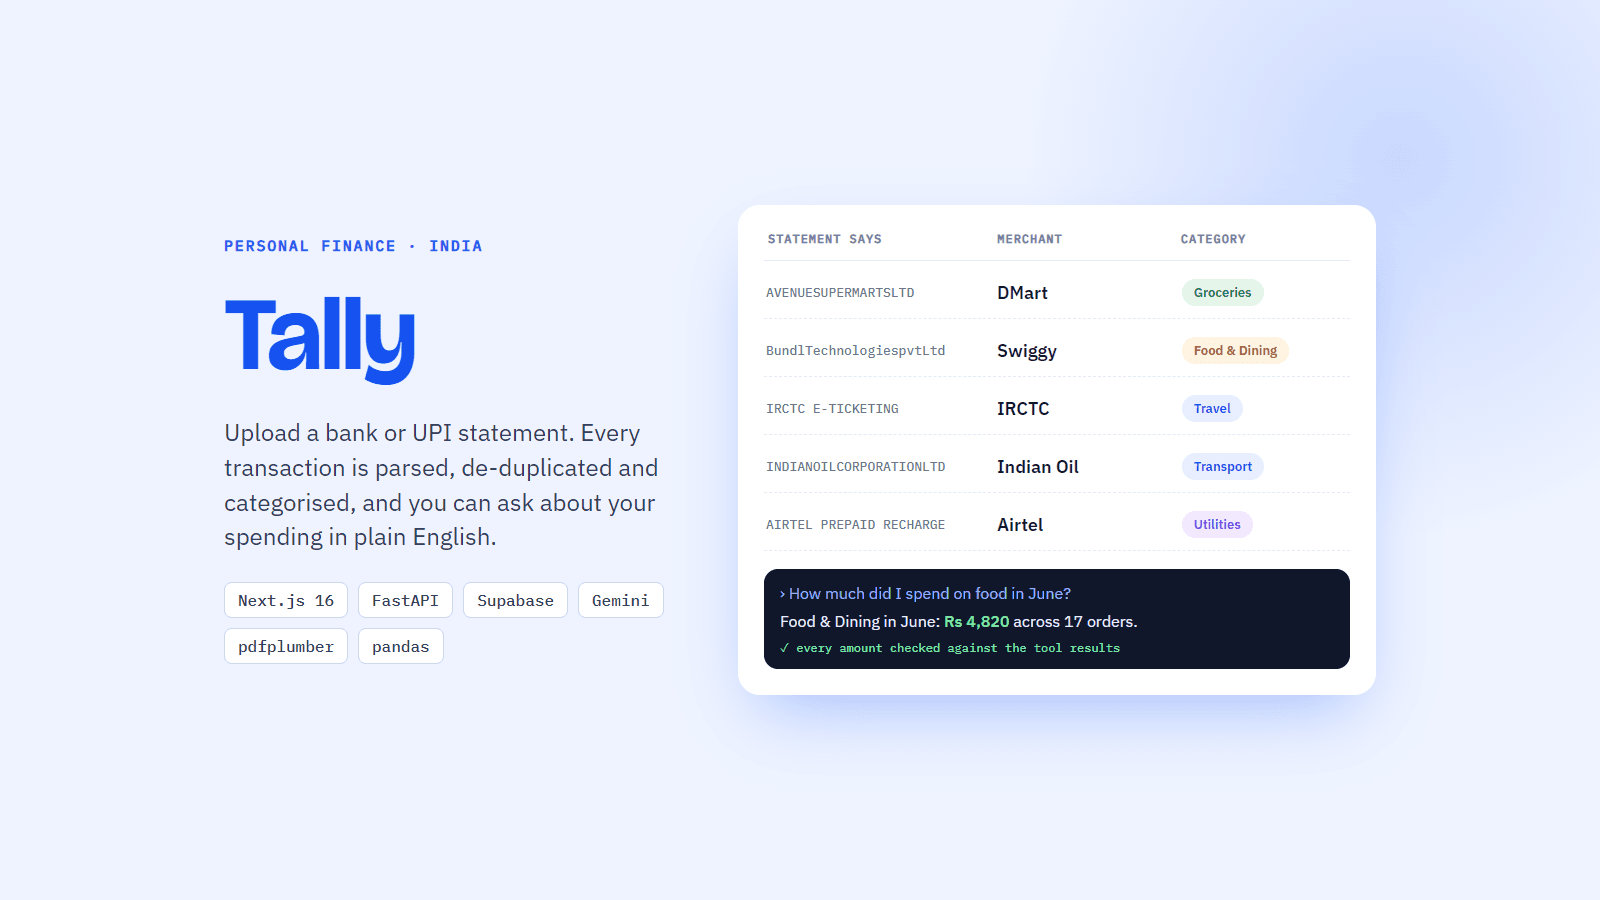
Tally: Bank Statements to Answers
A personal finance app for Indian bank and UPI statements. It parses, de-duplicates and categorises every transaction, then answers questions about your spending in plain English.
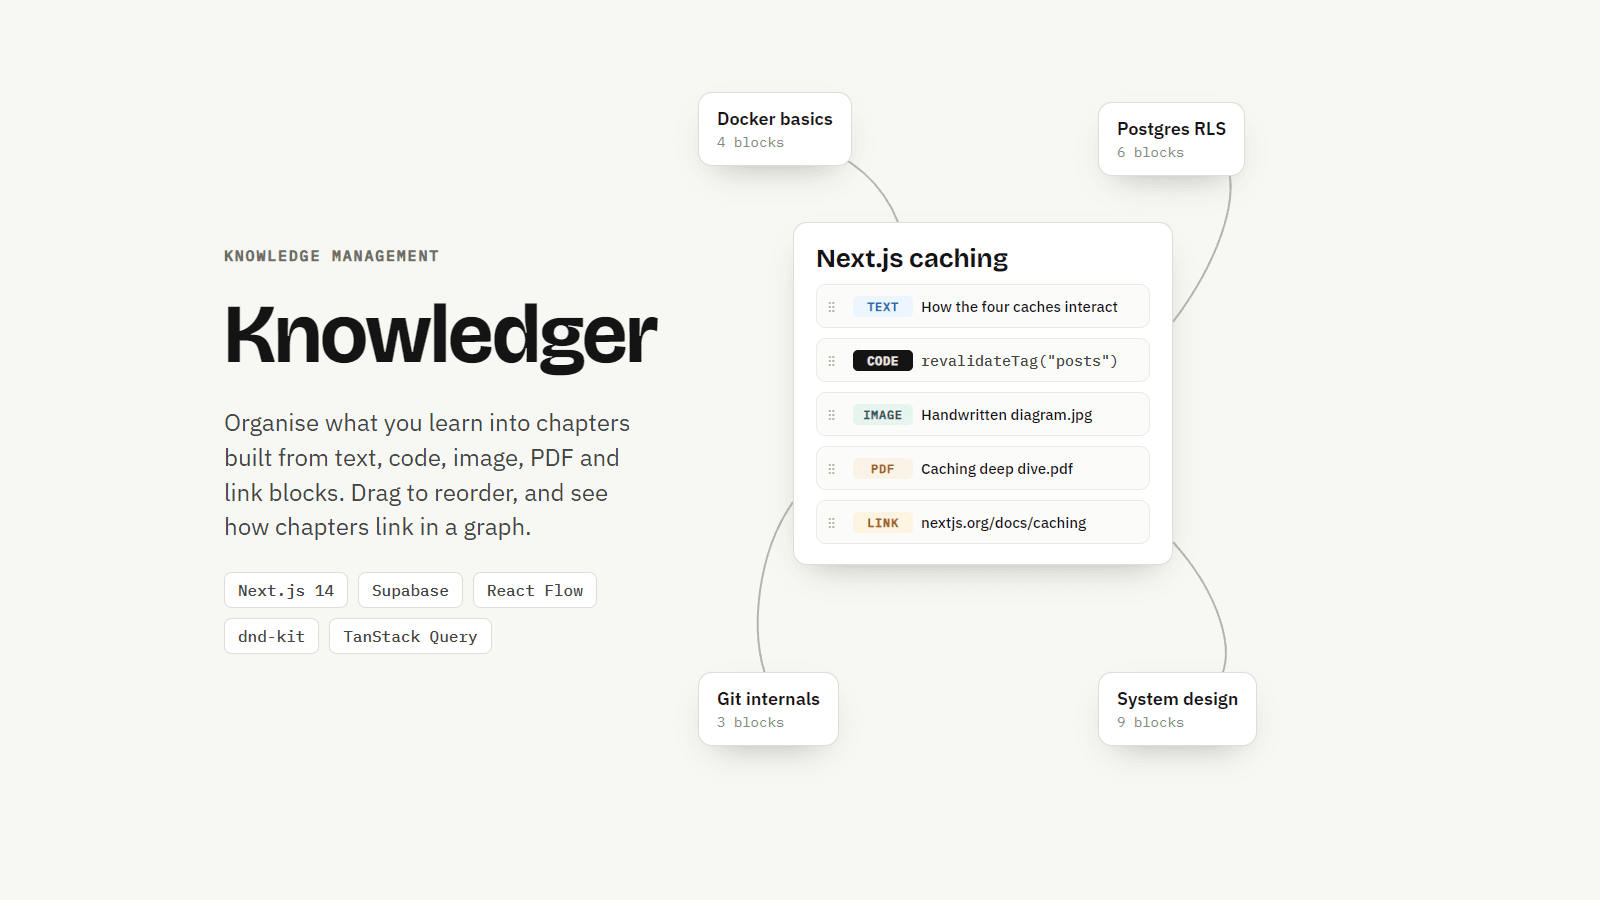
Knowledger: Chapters, Blocks and a Knowledge Graph
A Notion-style knowledge app. Organise what you learn into chapters made of text, code, image, PDF and link blocks, reorder them by drag and drop, and see how chapters connect in a graph.