IPL Analysis: 17 Seasons, Ball by Ball
A Kaggle notebook that cleans and explores ball-by-ball data from every IPL season from 2008 to 2024: 1,095 matches and about 261,000 deliveries.
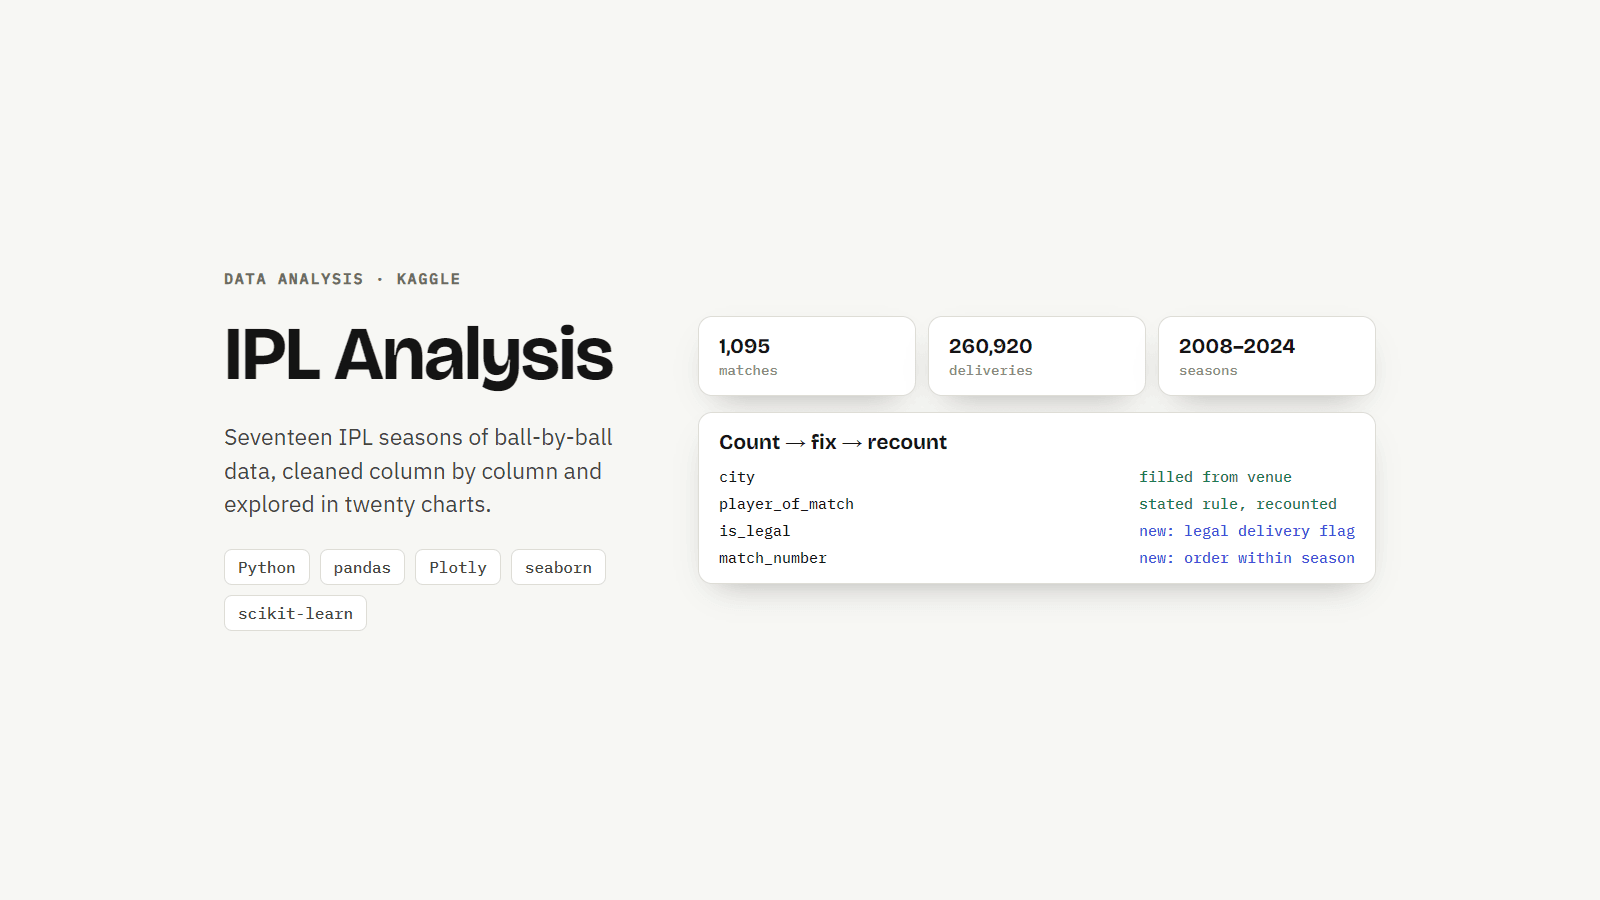
IPL Analysis
Seventeen seasons of the Indian Premier League, delivery by delivery. This notebook takes the complete IPL dataset from 2008 to 2024, cleans it carefully and asks it questions about seasons, teams and players.
The data
- 1,095 matches and 260,920 deliveries, merged into one frame with a row per ball.
- Runs in Kaggle against the mounted dataset, and was first written in Google Colab.
Cleaning, one column at a time
Every missing value is handled the same way: count it, fix it with a stated rule, then count again to prove the fix worked.
- Missing cities are filled from the data itself. A venue-to-city map is built from every row that has both, and only the two venues that never had a city are typed in by hand.
- New columns: a flag for legal deliveries and an adjusted ball number, plus the match number within each season, with a check that prints any gaps in the numbering.
- The right unit for the question. Questions about matches, such as batting first against chasing and the toss, are answered on one row per match rather than one row per ball.
What it explores
- Season-by-season trends
- Team records, batting first against chasing, and the effect of the toss
- Player records, including the top wicket takers
- Death-over batting and bowler economy
About twenty charts in all, most of them interactive Plotly figures.
Status
The analysis is complete and published on Kaggle. The notebook ends with a simple, exploratory match-winner model; the cleaning and the analysis above are the main work.
More projects
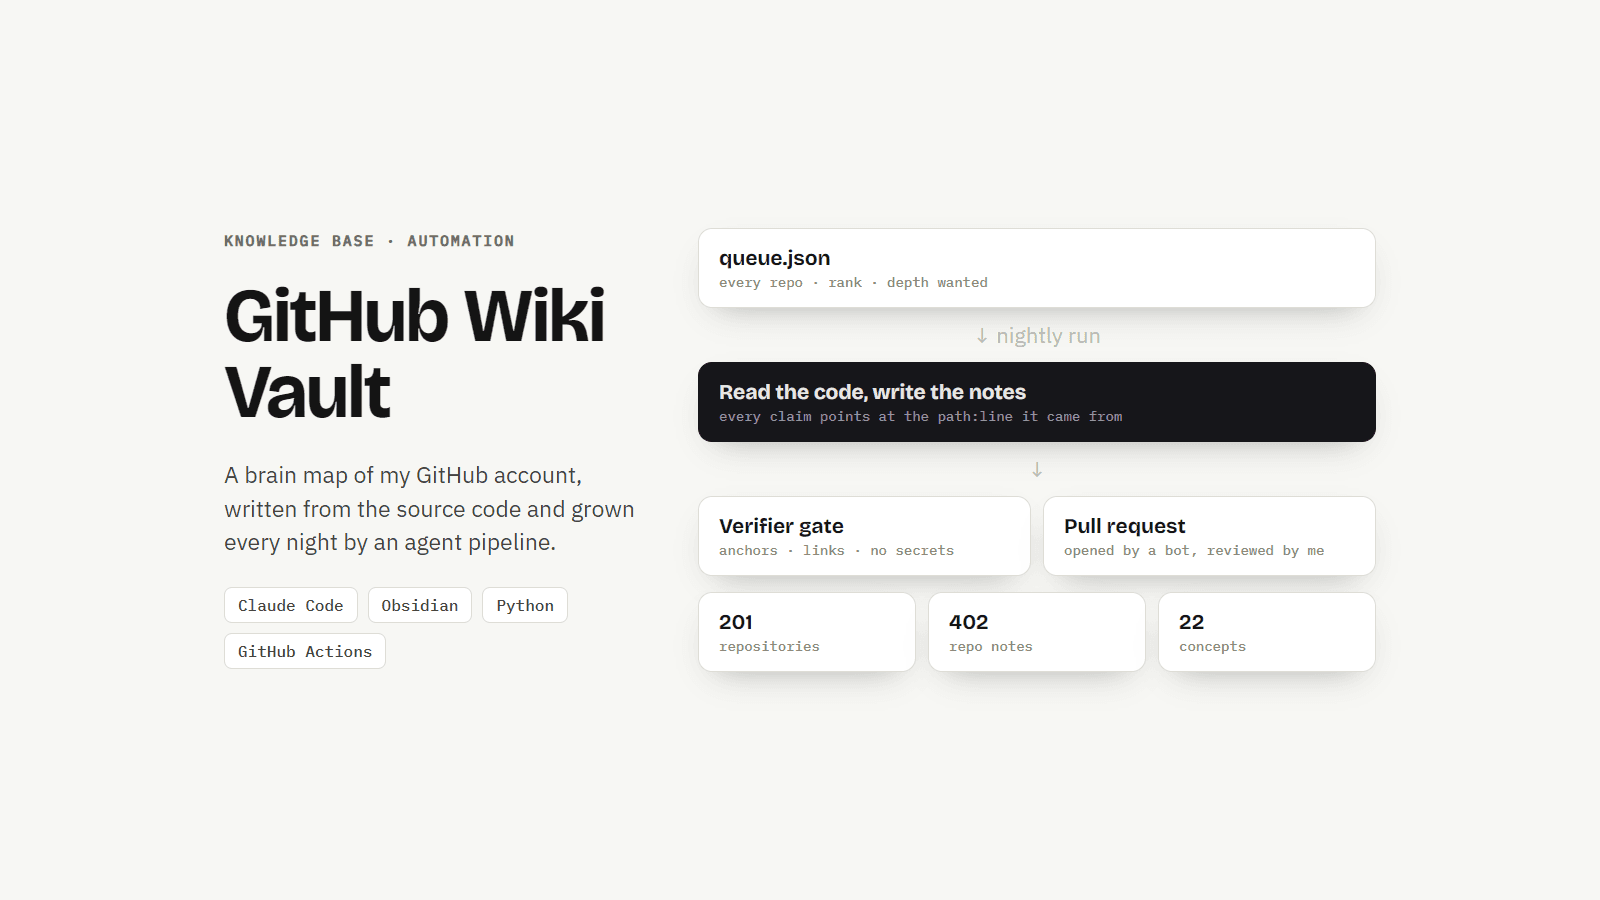
GitHub Wiki Vault: A Brain Map of My Code
An Obsidian vault that maps every repository on my GitHub account from its source code, grown every night by an AI agent pipeline that I designed and review. The code is private on purpose.
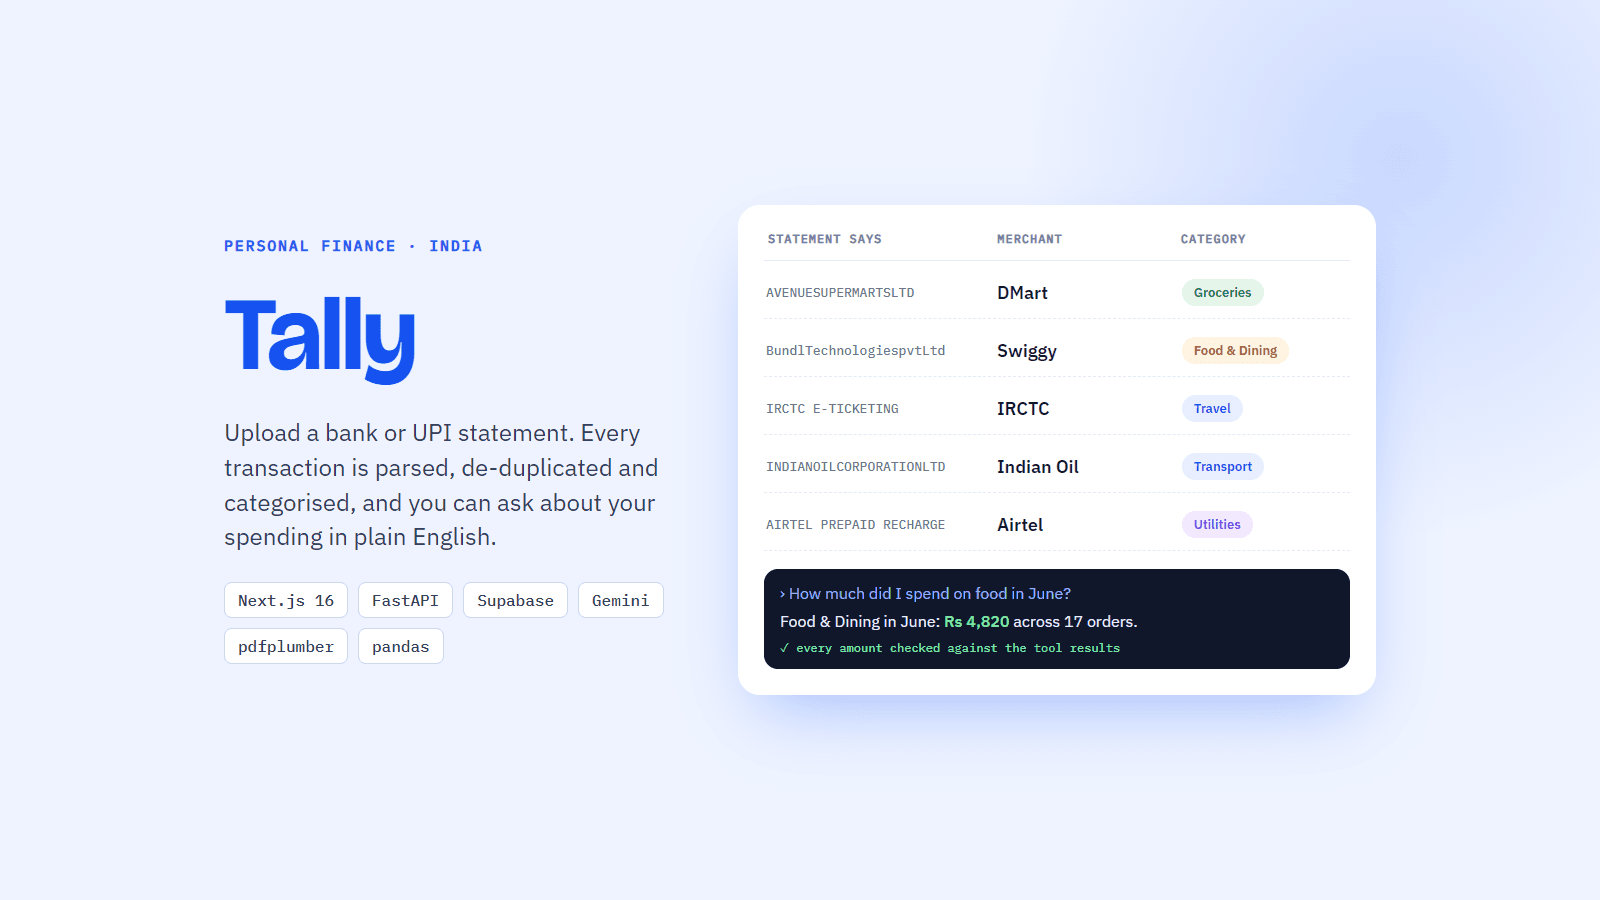
Tally: Bank Statements to Answers
A personal finance app for Indian bank and UPI statements. It parses, de-duplicates and categorises every transaction, then answers questions about your spending in plain English.
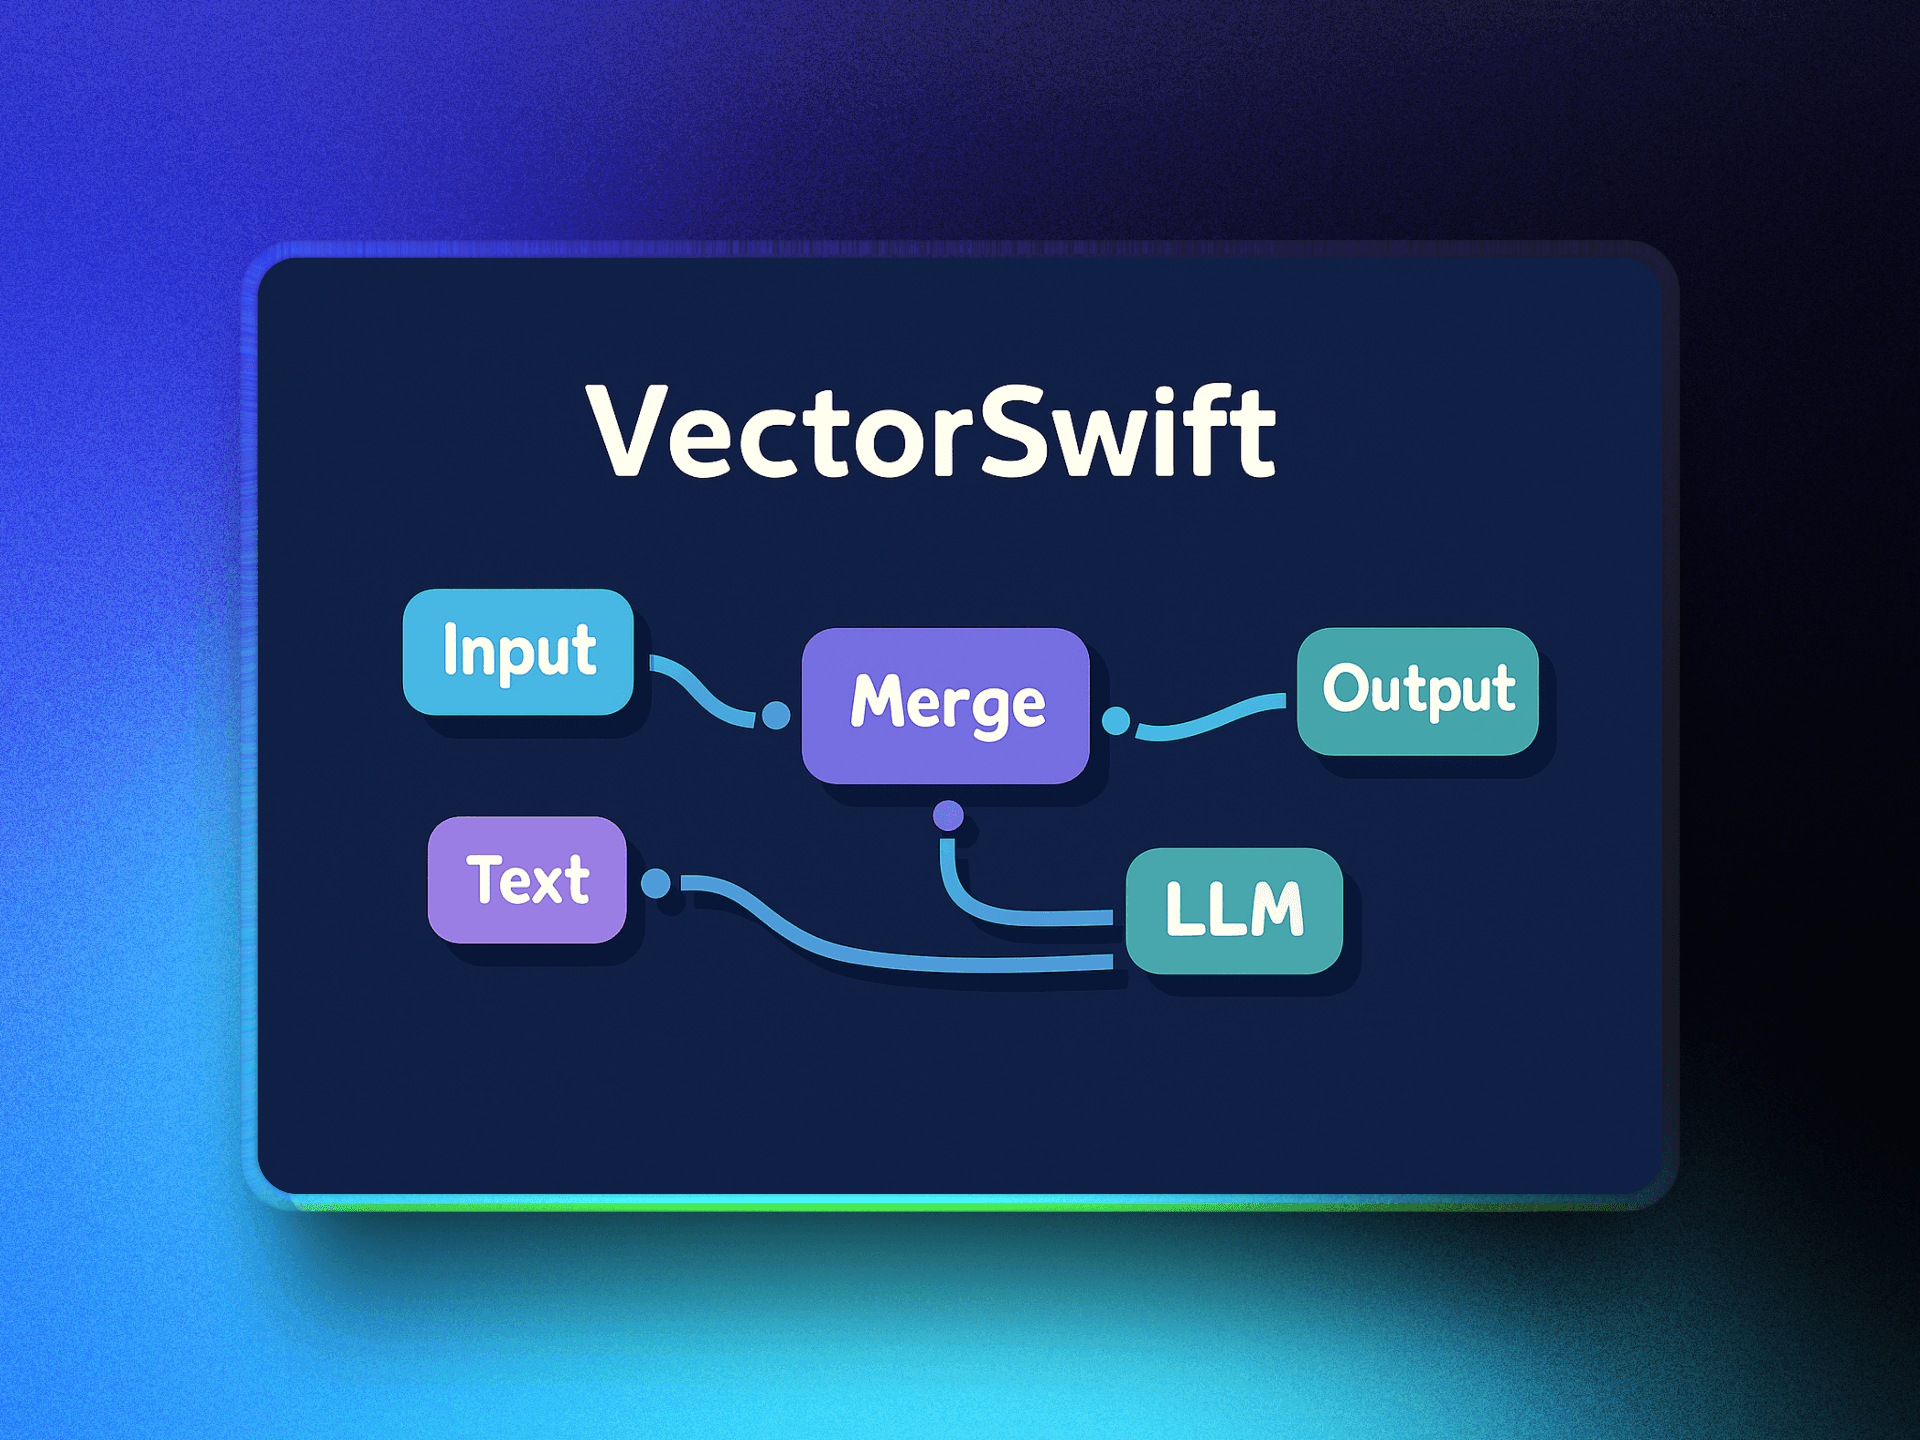
VectorSwift: Visual Pipeline Builder
Build, connect, and validate data pipelines visually with VectorSwift, a React-based DAG editor featuring real-time validation and backend integration.